| 发表文章 | 应用领域 |
| [1] Optical photothermal infrared spectroscopy for nanochemical analysis of pharmaceutical dry powder aerosols. Khanal, D. et al. International Journal of Pharmaceutics, 2023 | Pharmaceuticals |
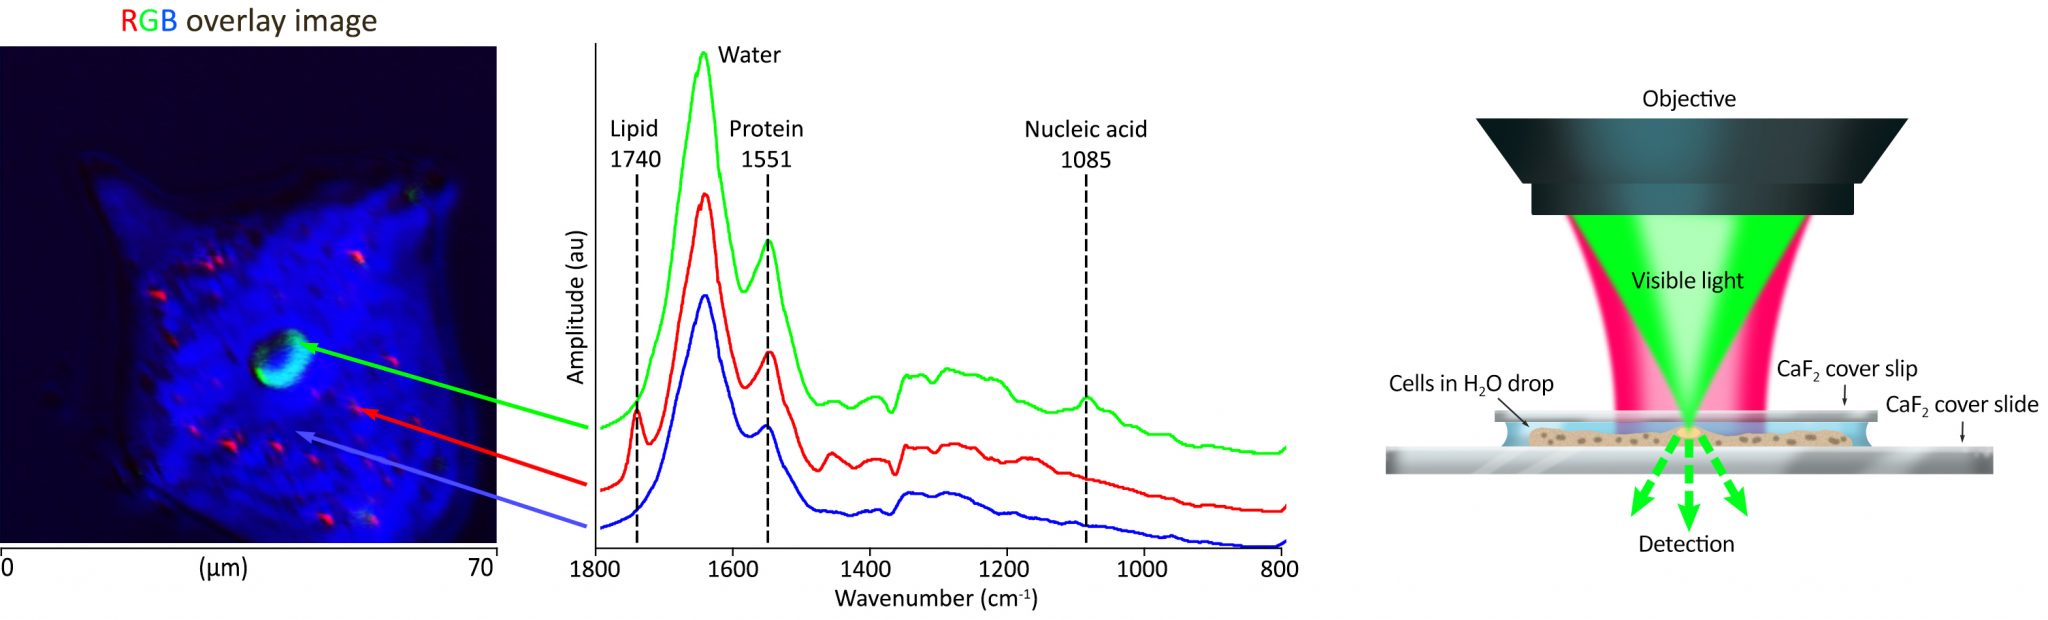
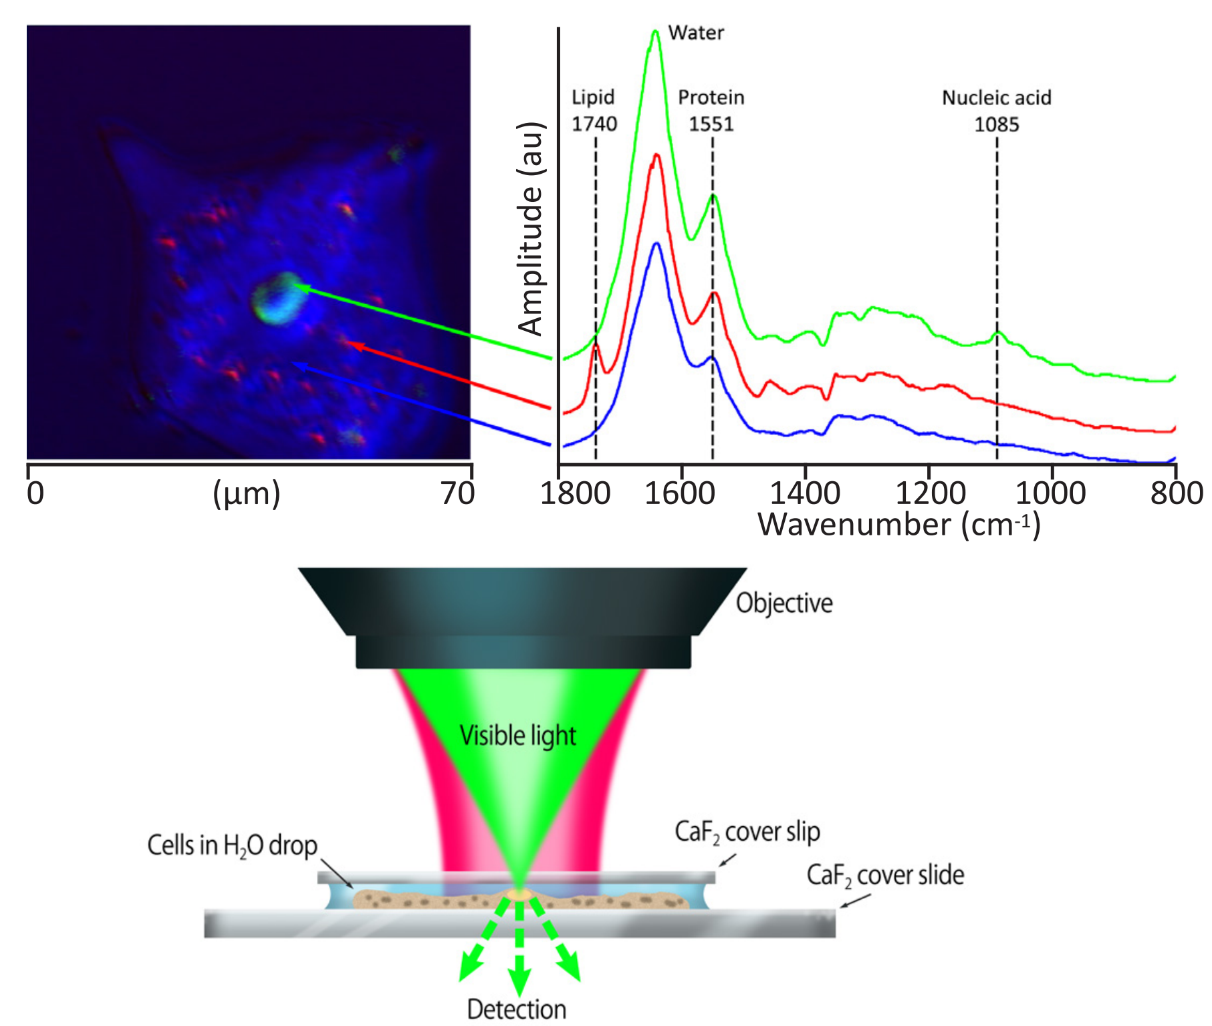
| [2] Fluorescently Guided Optical Photothermal Infrared Microspectroscopy for Protein-Specific Bioimaging at Subcellular Level. Prater, C et al.Journal of Medicinal Chemistry, 2023 | Life Science |
| [3]SOLARIS national synchrotron radiation centre in Krakow, Poland. Szlachetko, J. et al. The European Physical Journal Plus, 2023 | Central facility |
| [4]Innovative Vibrational Spectroscopy Research for Forensic Application. Weberm A. et al. Analytical Chemistry, 2023 | Forensic |
| [5]High-Throughput Antimicrobial Susceptibility Testing of Escherichia coli by Wide-Field Mid-Infrared Photothermal Imaging of Protein Synthesis. Guo, Z. et al.Analytical Chemistry, 2023 | Life Science |
| [6]Prebiotic-Based Nanoamorphous Atorvastatin Attenuates Nonalcoholic Fatty Liver Disease by Retrieving Gut and Liver Health. Cui, J, et al.Small Structures, 2023 | Life Science |
| [7]Optical photothermal infrared spectroscopy: A novel solution for rapid identification of antimicrobial resistance at the single-cell level via deuterium isotope labeling. Shams, S. et al.Front. Microbiol., 2023 | Life Science |
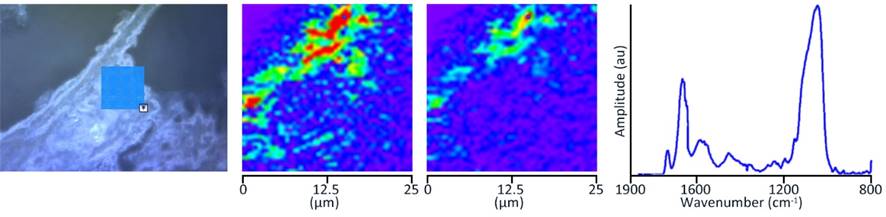
| [8]Mapping ancient sedimentary organic matter molecular structure at nanoscales using optical photothermal infrared spectroscopy. Jubb, A. et al.Organic Geochemistry, 2023 | Paleontology |
| [9]Concurrent surface enhanced infrared and Raman spectroscopy with single molecule sensitivity. Anderson, M. et al.Review of Scientific Instrument, 2023 | Instrumentation/Space exploration |
| [10]A review on analytical performance of micro- and nanoplastics analysis methods. Thaiba, B.M. et al.Arabian Journal of Chemistry, 2023 | Microplastics |
| [11]Video-rate Mid-infrared Photothermal Imaging by Single Pulse Photothermal Detection per Pixel. Xin, J. et al.bioRxiv, 2023 | Life Science |
| [12]Microfluidics as a Ray of Hope for Microplastic Pollution. Ece, E. et al.biosensors, 2023 | Microplastics |
| [13]Solid–Electrolyte Interface Formation on Si Nanowires in Li-Ion Batteries: The Impact of Electrolyte Additives. Sarra, A. et al.Batteries, 2023 | Batteries |
| [14]Critical assessment of approach towards estimation of microplastics in environmental matrices. Raj, D. et al.Land Degradationa and Development, 2023 | Microplastics |
| [15]Micro to Nano: Multiscale IR Analyses Reveal Zinc Soap Heterogeneity in a 19th-Century Painting by Corot. Ma, X. et al.Analytical Chemistry, 2022 | Art and cultural heritage |
| [16]Development of a Binary Digestion System for Extraction Microplastics in Fish and Detection Method by Optical Photothermal Infrared. Yan, F. et al.Frontiers in Marine Science, 2022 | Microplastics |
| [17]Automated analysis of microplastics based on vibrational spectroscopy: are we measuring the same metrics?. Dong, M. et al.Analytical and Bioanalytical Chemistry, 2022 | Microplastics |
| [18]Vitamin D and Calcium Supplementation Accelerate Vascular Calcification in a Model of Pseudoxanthoma Elasticum. Bouderlique, E. et al.International Journal of Molecular Sciences, 2022 | Pharmaceuticals |
| [19]Novel optical photothermal infrared (O-PTIR) spectroscopy for the noninvasive characterization of heritage glass-metal objects. Marchetti, A. et al.Science Advance, 2022 | Art and cultural heritage |
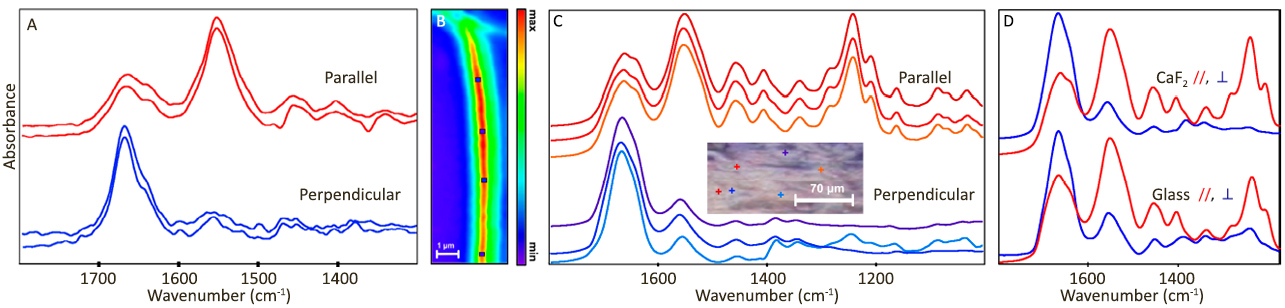
| [20]Polarization Sensitive Photothermal Mid-Infrared Spectroscopic Imaging of Human Bone Marrow Tissue. Mankar, R. et al.Applied Spectroscopy, 2022 | Biomedical and life science |
| [21]Identification of spectral features differentiating fungal strains in infrared absorption spectroscopic images. Stancevic, D. et al.Lund Univ, Ugrad Thesis, 2022 | Bio and environmental |
| [22]Optical photothermal infrared spectroscopy can differentiate equine osteoarthritic plasma extracellular vesicles from healthy controls. Clarke, E. et al.BioXvid, 2022 | BioXvid |
| [23]Correlative imaging to resolve molecular structures in individual cells: substrate validation study for super-resolution infrared microspectroscopy. Paulus, A. et al.Nanomedicine: Nanotechnology, Biology, and Medicine, 2022 | Biomedical and life science |
| [24]Emerging nuclear methods for historical painting authentication: AMS-14C dating, MeV-SIMS and O-PTIR imaging, Global IBA, Differential-PIXE and Full-field PIXE mapping. Calligaro, T. et al.Forensic Science International, 2022 | Art and cultural heritage |
| [25]Strong PP/PTFE microfibril reinforced composites achieved by enhanced crystallization under CO2 environment. Zhang, A. et al.Polymer Testing, 2022 | Polymer |
| [26]Leveraging high-resolution spatial features in mid-infrared spectroscopic imaging to classify tissue subtypes in ovarian cancer. Gajjela, C. et al.BioarXiv, 2022 | Biomedical and life science |
| [27]APPLICATION OF OPTICAL PHOTOTHERMAL INFRARED (O-PTIR) SPECTROSCOPY TO ASSESS BONE COMPOSITION AT THE SUBMICRON SCALE. Reiner, E. et al.Temple Univ, Master thesis, 2022 | Biomedical and life science |
| [28]Matrix/Mineral Ratio and Domain Size Variation with Bone Tissue Age: a Photothermal Infrared Study. Ahn, T. et al.Journal of Structural Biology, 2022 | Journal of Structural Biology |
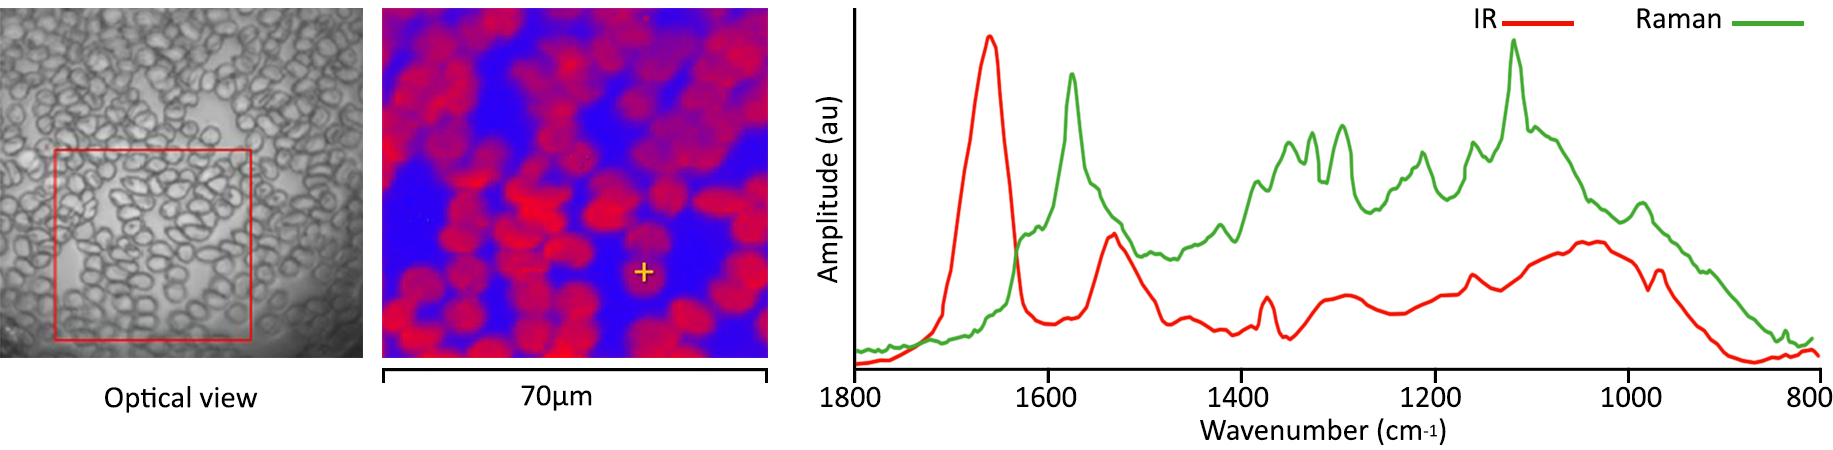
| [29]Simultaneous Raman and infrared spectroscopy: a novel combination for studying bacterial infections at the single cell level. Lime, C. et al.Chemical Science, 2022 | Biomedical and life science |
| [30]Phase separation in surfactant-containing amorphous solid dispersions: Orthogonal analytical methods to probe the effects of surfactants on morphology and phase composition. Yang, R. et al.International Journal of Pharmaceutics, 2022 | Pharmaceuticals |
| [31]Super-Resolved 3D Mapping of Molecular Orientation Using Vibrational Techniques. Koziol, P. et al.Journal of American Chemical Society, 2022 | Polymer |
| [32]Analysis of the Chemical Distribution of Self-assembled Microdomains with Selective Localization of Amine-functionalized Graphene Nanoplatelets by Optical Photothermal Infrared Microspectroscopy. He, S. et al.Analytical Chemistry, 2022 | Material - graphene |
| [33]Synovial joint cavitation initiates with microcavities in interzone and is coupled to skeletal flexion and elongation in developing mouse embryo limbs. Kim, M. et al.Biology Open, 2022 | Biomedical and life science |
| [34]Infrared Spectroscopy–Quo Vadis?. Hlavatsch, M. et al.applied sciences, 2022 | infrared spectroscopy, photonics |
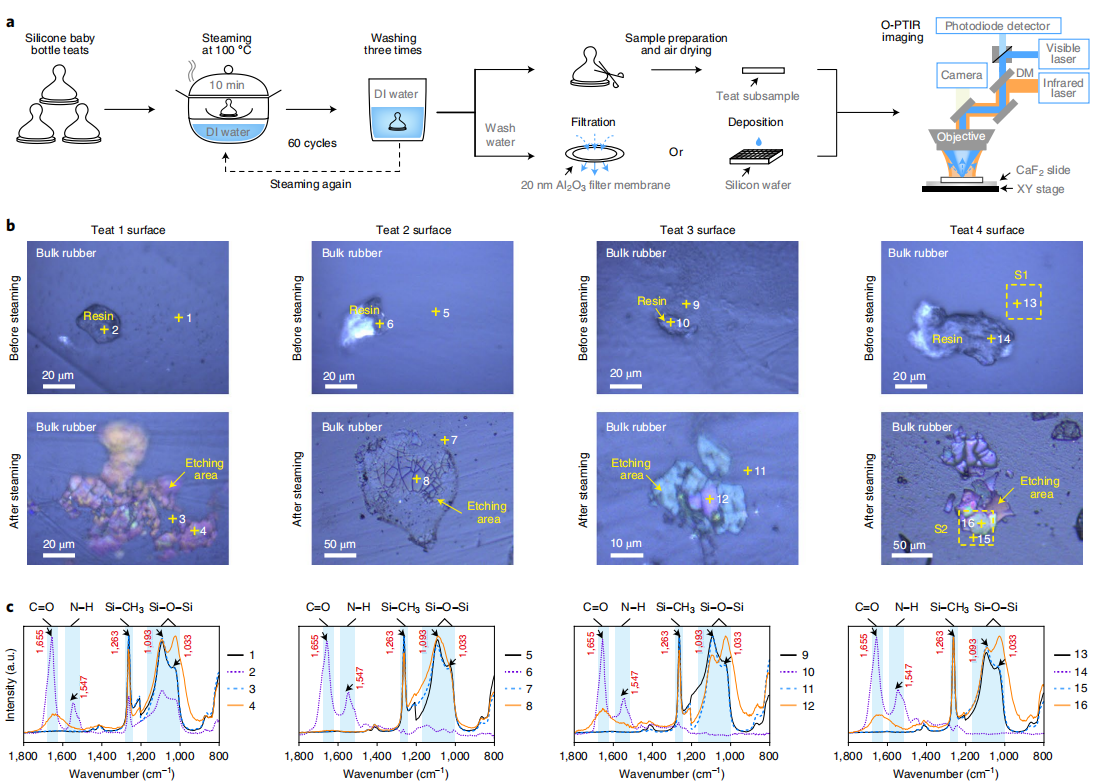
| [35]Steam disinfection enhances bioaccessibility of metallic nanoparticles in nano-enabled silicone-rubber baby bottle teats, pacifiers, and teethers. Su, Y. et al.Journal of Environmental Science, 2022 | Microplastics |
| [36]NOVEL SPECTROSCOPY TECHNIQUES USED TO INTERROGATE EQUINE OSTEOARTHRITIC EXTRACELLULAR VESICLES. Clarke, E. et al.Osteoarthritis and Cartilage, 2022 | Biomedical and life science |
| [37]Using mid infrared to perform investigations beyond the diffraction limits of microcristalline pathologies: advantages and limitation of Optical PhotoThermal IR spectroscopy. Bazin, D. et al.Comptes Rendus. Chimie, 2022 | Biomedical and life science |
| [38]Optical photothermal infrared spectroscopy can differentiate equine osteoarthritic plasma extracellular vesicles from healthy controls. Clarke, E. et al.Analytical Methods, 2022 | Biomedical and life science |
| [39]Probing Individual Particles Generated at the Freshwater–Seawater Interface through Combined Raman, Photothermal Infrared, and X-ray Spectroscopic Characterization. Mirrielees, J. et al.ACS Meas. Sci. Au, 2022 | Environmental and Microplastics |
| [40]Parts-per-Million Detection of Trace Crystal Forms Using AF-PTIR Microscopy. Razumtcev, A. et al.Analytical Chemistry, 2022 | Pharmaceuticals |
| [41]Curious Corrosion Compounds Caused by Contact: A Review of Glass-InducedMetal Corrosion onMuseum Exhibits (GIMME). Eggert, G. et al.corrosion and materials degradation, 2022 | Art and conservation |
| [42]Comparison of ATR–FTIR and O-PTIR Imaging Techniques for the Characterisation of Zinc-Type Degradation Products in a Paint Cross-Section. Chua, L. et al.Molecules, 2022 | Cultural heritage |
| [43]Ultrafast Widefield Mid-Infrared Photothermal Heterodyne Imaging. Paiva, E. et al.Analytical Chemistry, 2022 | Photonics, bio |
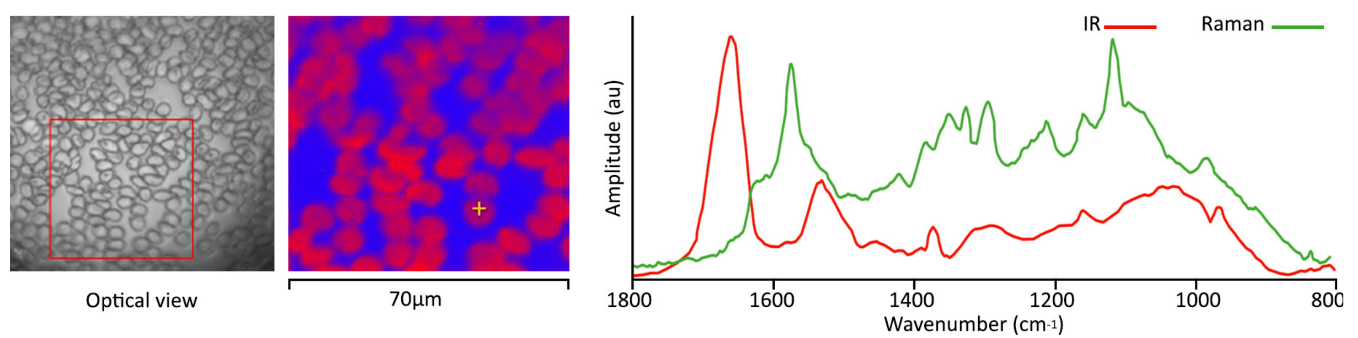
| [44]Chapter 8 - Raman-integrated optical photothermal infrared microscopy: technology and applications. Li, X. et al.Molecular and Laser Spectroscopy, 2022 | Photonics, bio |
| [45]Chapter 9 - Optical photothermal infrared spectroscopic applications in microplastics—comparison with Fourier transform infrared and Raman spectroscopy. Krafft, C. et al.Molecular and Laser Spectroscopy, 2022 | Microplastics |
| [46]Contribution of Infrared Spectroscopy to the Understanding of Amyloid Protein Aggregation in Complex Systems. Ami, D. et al.Front. Mol. Biosci., 2022 | Bio and life science review |
| [47]Novel Submicron Spatial Resolution Infrared Microspectroscopy for Failure Analysis of Semiconductor Components. Zulkifli, S. et al.IPFA 2022 Proceedings, 2022 | FA/contamination |
| [48]Overcoming challenging Failure Analysis sample types on a single IR/Raman platform. Anderson, J. et al.ISTFA 2022 Proceedings, 2022 | FA/contamination |
| [49]Boosting Electrocatalytic Nitrate-to-Ammonia Conversion via Plasma Enhanced CuCo Alloy–Substrate Interaction. Wu, A. et al.ACS. Sustainable Chem. Eng., 2022 | Catalysis |
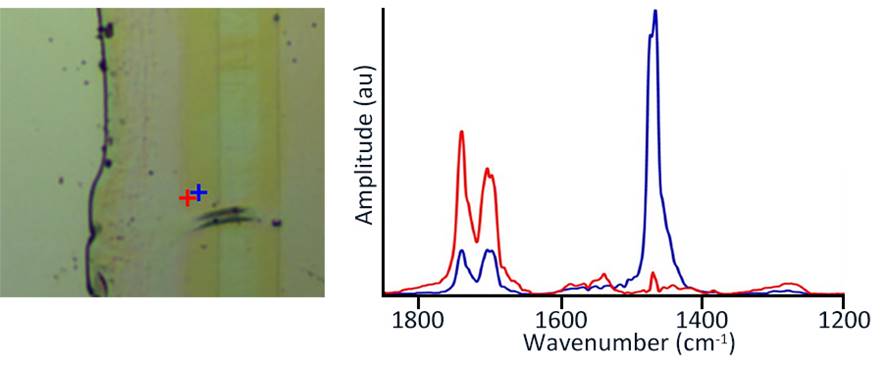
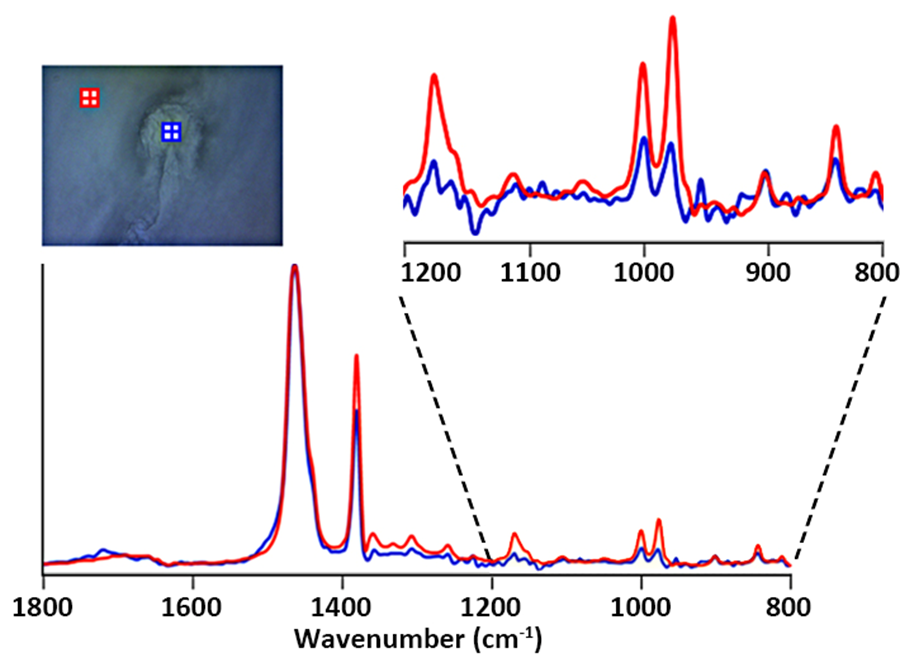
| [50]Optical photothermal infrared spectroscopy with simultaneously acquired Raman spectroscopy for two-dimensional microplastic identification. Boeke, J. et al.Scientific Report, 2022 | Microplastics |
| [51]Super-resolution infrared microspectroscopy reveals heterogeneous distribution of photosensitive lipids in human hair medulla. Sandt, C. et al.Talanta, 2022 | Life science, hair |
| [52]Functional group Inhomogeneity in Graphene Oxide using Correlative Absorption Spectroscopy. Yoo, J. et al.Applied Surface Science, 2022 | Material science |
| [53]Polystyrene: A Self-Dispersing, Ultralow Loading Additive for Improving the Breakdown Strength of Polypropylene for High Voltage Power Cable Applications. Lee, S. et al.ACS Applied Polymer Materials, 2022 | Polymer, material science |
| [54]Super-Resolution Infrared Imaging of Polymorphic Amyloid Aggregates Directly in Neurons (Front Cover), Advanced Science, 2020. |
|
| [55]Self-formed 2D/3D Heterostructure on the Edge of 2D Ruddlesden-Popper Hybrid Perovskites Responsible for Intriguing Optoelectronic Properties and Higher Cell |
|
| [56]Efficiency, Applied Physics, 2020. |
|
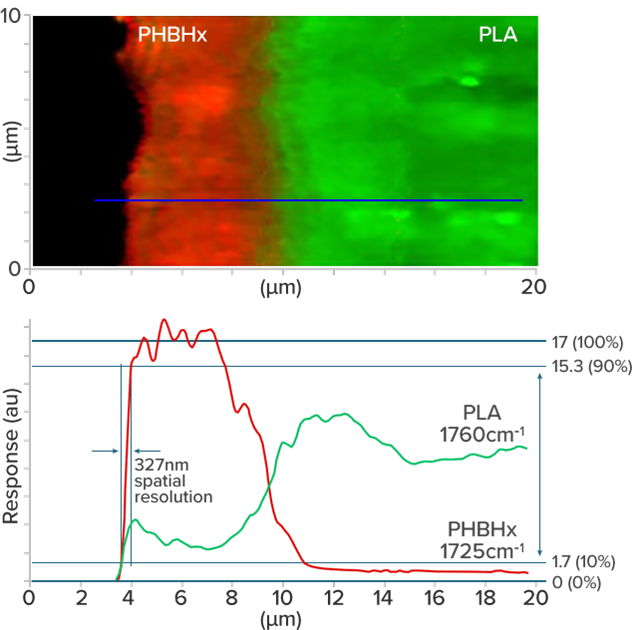
| [57]Two-Dimensional Correlation Analysis of Highly Spatially Resolved Simultaneous IR and Raman Spectral Imaging of Bioplastics Composite Using Optical Photothermal Infrared and Raman Spectroscopy, The Journal of Molecular Structure, 2020. |
|
| [58]Super resolution correlative far-field submicron simultaneous IR and Raman microscopy: a new paradigm in vibrational spectroscopy, Advanced Chemical Microscopy for Life Science and Translational Medicine, 2020. |
|
| [59]Submicron-resolution polymer orientation mapping by optical photothermal infrared spectroscopy, International Journal of Polymer Analysis and Characterization, 2020. |
|
| [60]Bulk to nanometre-scale infrared spectroscopy of pharmaceutical dry powder aerosols, Analytical Chemistry, 2020. |
|
| [61]Optical Photothermal Infrared Micro-Spectroscopy – A New Non-Contact Failure Analysis Technique for Identification of<10mm Organic Contamination in the Hard drive and other Electronics Industries. Microscopy Today, 2020. |
|
| [62]Spontaneous Formation of 2D-3D Heterostructures on the edges of 2D RuddlesdenPopper Hybrid Perovskite Crystals, Chemistry of Materials, 2020. |
|
| [63]Simultaneous Optical Photothermal Infrared (OPTIR) and Raman Spectroscopy of Submicrometer Atmospheric Particles, Analytical Chemistry, 2020. |
|
| [64]Detection of high explosive materials within fingerprints by means of optical-photothermal infrared spectromicroscopy, Analytical Chemistry, 2020. |
|
| [65]Polarized O-PTIR of collagen and individual fibril strands reveals orientation, Molecules Special Edition: “Biomedical Raman and Infrared Spectroscopy: Recent Advancement and Applications, 2020. |
|
| [66]Evolution of a Radical-Triggered Polymerizing High Internal Phase Emulsion into an Open-Cellular Monolith, Macromolecular Chemistry and Physics, 2019. |
|
| [67]A Global Perspective on Microplastics, Journal of Geophysical Research: Ocean, 2019. |
|
| [68]Label-Free Super-Resolution Microscopy. Springer, Biological and Medical Physics, Biomedical Engineering. 2019 |
|
| [69]Advances in Infrared Microspectroscopy and Mapping Molecular Chemical Composition at Submicrometer Spatial Resolution, Spectroscopy 2018. |
|
| [70]Mid-Infrared Photothermal Imaging of Active Pharmaceutical Ingredients at Submicrometer Spatial Resolution, Ji-Xin Cheng et al., Anal. Chem. 2017, 89, 4863-4867. |
|
| [71]Depth-resolved mid-infrared photothermal imaging of living cells and organisms with submicrometer spatial resolution, Ji-Xin Cheng et al., Sci. Adv. 2016, 2, e1600521. |
|